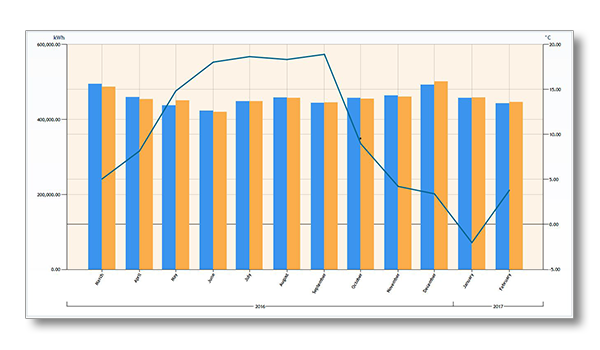
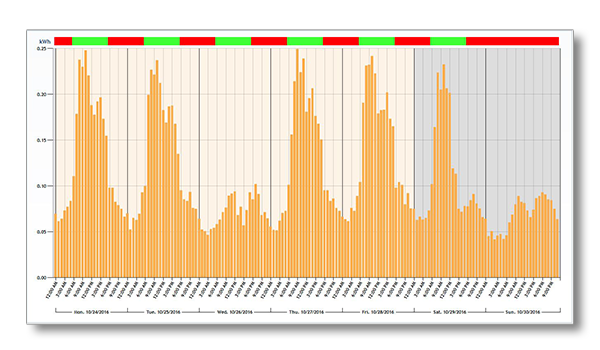
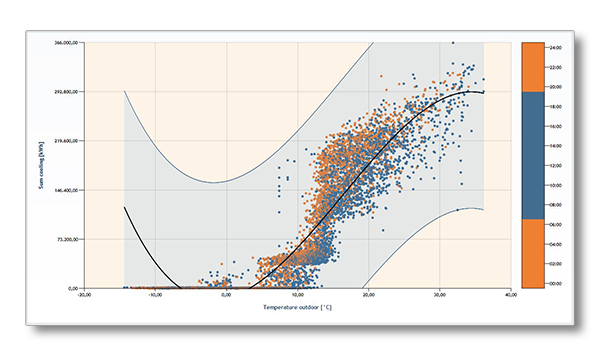
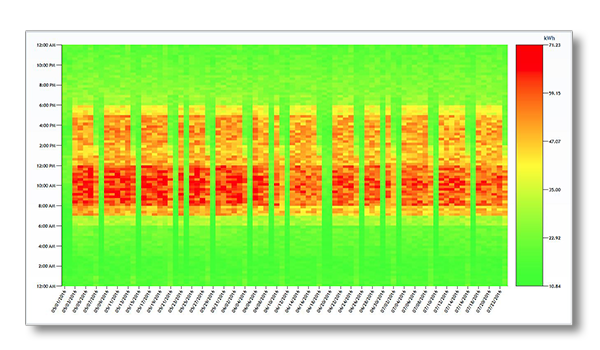
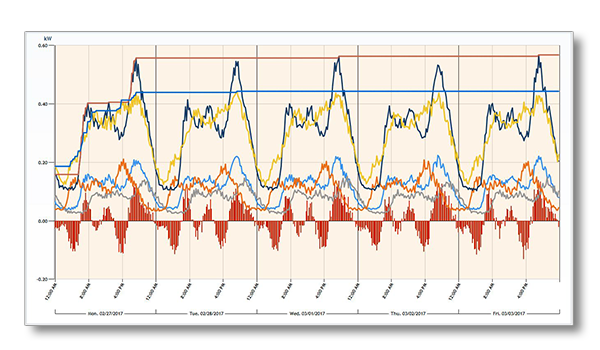
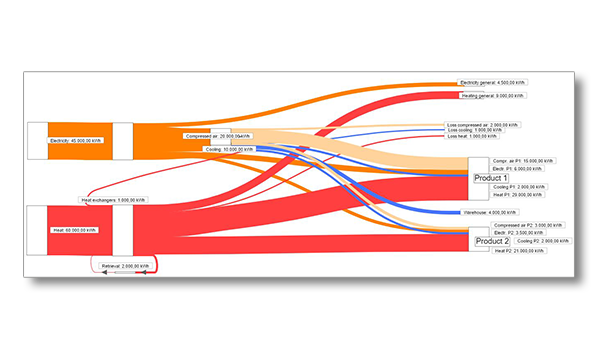
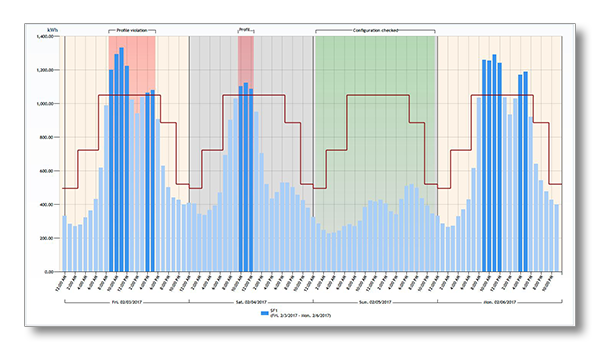
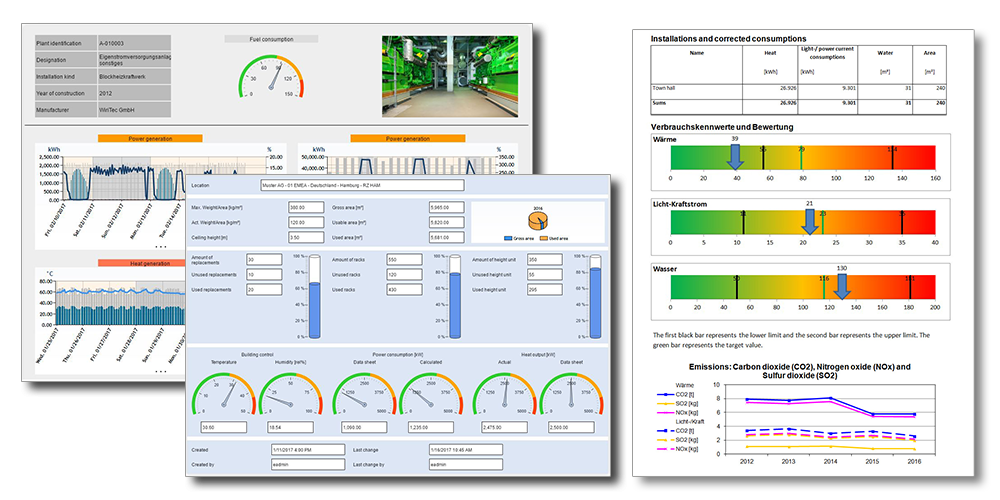
An energy data management system must be able to collect many million or even billions of data sets and make them available for evaluations at short notice. WiriTec meets the challenge to clearly visualise this data, relating it chronologically and logically and offer an easy navigation possibility.
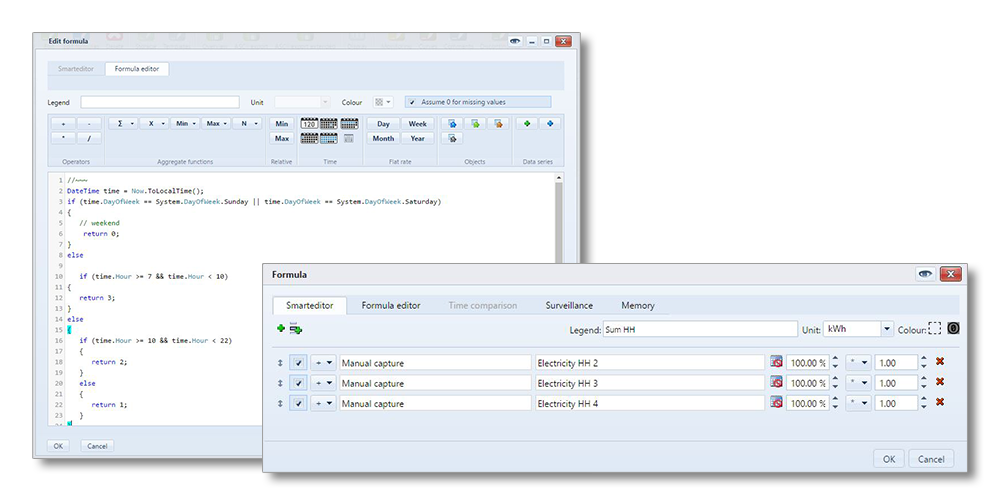
In the WiriTec system nothing is pre-calculated but data are prepared and displayed at the time of evaluation according to selected time periods and intervals on-the-fly. We have optimised the underlying database, the energy data server exactly for this application in order to display even large amounts of data without disturbing waiting times. These technical details form the basis for a series of tools and features which facilitate unique evaluation flexibility for the user.
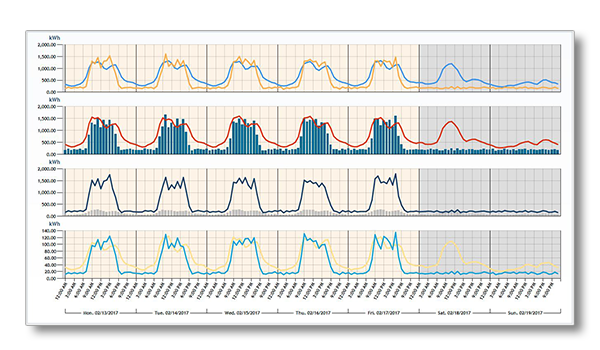
The time slider and time selection are two powerful tools for the user in order to navigate on the timeline. The user can select via corresponding buttons if data are displayed in an absolute (a date or time period) or relative (last 3 days, last month, etc.) period of time. A separate timeline can be chosen for each selected data set besides the full-time selection for the complete chart evaluation by the same means. In this case, several time axes are illustrated in the chart.
For annual evaluations the beginning of the year can be adjusted to the individual business year with a few mouse clicks, if necessary. For considerations beyond the date line, you can move the start of the day to the forefront or backwards. Analogously while doing a comparison over a period of several months, weekdays can be superimposed and the comparison of the correct weekdays can be ensured with the help of a day offset. The time slider allows selected periods of time to be enlarged and minimized via Drag & Drop. It is possible to shift an entire interval on the time axis as well.


